At this point, there’s only one more thing you need to do – and this is the hardest part – stay the course: which means to continue saving, investing, and maintaining your asset allocation, regardless of what the market or economy is doing. This is critical but not easy because it goes against human nature. We humans are not wired very well in this regard. It’s what legendary investor Charles Ellis calls the Emotional Game, which can quickly derail even the best laid investment plans if we can’t get a handle on it.
Think Decades, Not Days
Most of us can’t help but dwell on the short-term swings in the stock market, buying when the market is going up and panic selling during the inevitable market declines. The daily, weekly, monthly, even yearly market declines are scary, no doubt, but the key is to focus on returns over 10- to 20-year time periods. Think decades, not days.
Squint Your Eyes
For example, the following figures show the 1-year and rolling 10-year and 20-year returns for the market from 1928 through 2014. Rolling 10-year returns are the annualized return for 1980 through 1989, 1981 through 1990, 1982 through 1991, 1983 through 1992, etc. – the year shown on these figures is the last year of the 10- or 20-year rolling periods. These are important to understand, so let’s walk through them.
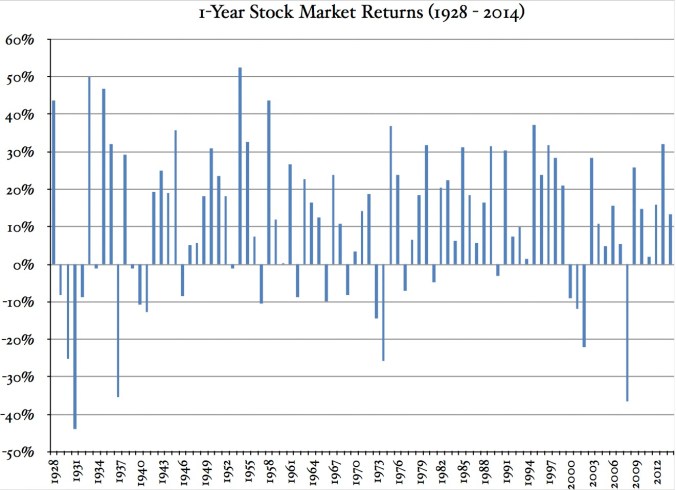
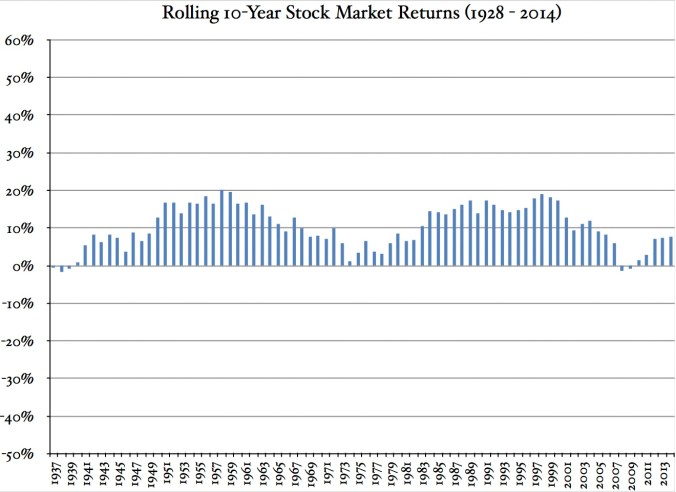
Note the relatively wild swings in the 1-year returns, with a range of +53% in 1954 to -44% in 1931, with 24 losing years and 63 gaining years during this period, a ratio of about 1 to 2.6. But let’s pull back and have a look at the rolling 10-year and 20-year returns. The rolling 10-year returns range from -1.7% (1929 through 1938) to 20% (1949 through 1958), with only five out of 77 10-year rolling periods with a negative annualized return.
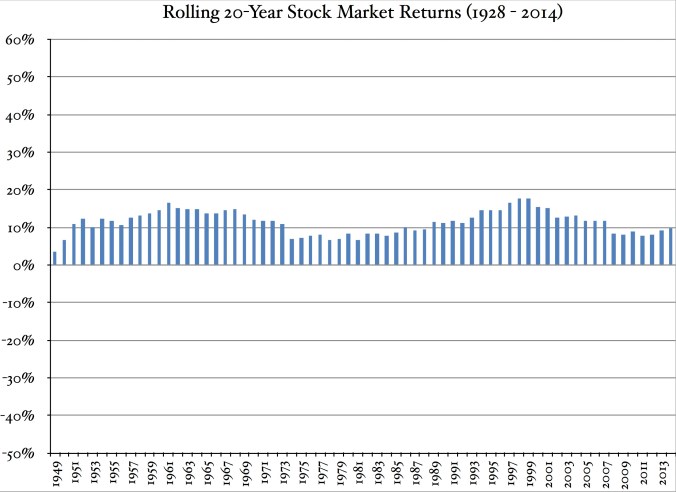
The rolling 20-year returns range from 2.4% (1929 through 1948) to 17.7% (1980 through 1999), with zero negative rolling periods. Squint your eyes while looking at this graph. You’ll notice that the returns essentially converge around 10%, undulating above and below this number. What you’re looking at is the reward for taking risk and owning a part of all the publicly-traded companies in the U.S.: the dividends and earnings growth of all these companies over time. It’s the end result of long-term investing.
Still Not Easy
Stock market returns become more subdued when viewed over longer time intervals as they converge toward the expected return which, again, is the result of the initial dividend yield plus subsequent dividend growth. This is not to say that if you hold stocks for 20+ years that market volatility is diminished. Hidden within the 10- and 20-year rolling returns are years with heavy losses; hidden within the 1-year returns are months with heavy losses; and hidden within the monthly returns are days and weeks with heavy losses. So while over a period of 20+ years the market will likely return an annualized 8% or so, there will always be wild short-term swings to contend with throughout the entire investment time period. In other words, market volatility never ends.
Rip Van Winkle
What to do about staying the course? The optimal scenario is to take a “Rip Van Winkle” approach and completely ignore the market and the value of your portfolio and only occasionally look to see if you need to rebalance. But very few can manage this Zen approach. For the rest of us, here are some tips to help weather the inevitable down markets and keep from hitting the panic button.
Adult Education
The most effective way to stay the course is to educate yourself on the history of capital markets. It’s comforting to look into the face of a down market and say “I’ve seen this movie before and I know how it ends”. The prevailing idea is that, during the course of delivering a long-term, annualized return of around 8%, the market will occasionally decline, sometimes sharply, before recovering. This education will also provide insight on the advantages of bear markets, in that stocks bought during this period, while difficult to stomach, will likely have above-average returns over the long term. There is no more basic investment concept than this: the less you pay for an asset, the better your rate of return when you finally sell. For more on this, read The Bucking Bronco.
Don’t Peek
Try not to peek at your portfolio more than once a quarter, and preferably once a year, on December 31. This goes against human nature, I know, and is probably not realistic for most of us, but try your best. The more you look at your portfolio, the more likely you will panic and make rash decisions. Also, don’t equate each day’s gains or losses into dollar amounts. If the market declines and your portfolio is down $5,000, try to quiet your monkey brain that’s screaming “I just lost five grand!” Turn off the t.v. and take a walk in the woods. Knit a scarf. Go for a swim. Do whatever it takes to turn your attention to something else. Remember that your portfolio has grown to its present size because you’re invested in stocks. Going from $200,000 to $195,000 on a down day is still much better than a placid, all T-bill portfolio that’s only grown to $20,000.
There for Your Convenience
The daily stock market prices are there for your convenience. If you think the stock price is too low relative to the business fundamentals of your stock holdings, then ignore the price. If you don’t need to sell a stock, then don’t (this is why money you’ll need in the next three years or so should not be invested in the stock market: you might be forced to sell stocks during a market decline). Focus instead on the number of shares you’re accruing and the interest and dividends that your portfolio is generating each year. The economy will eventually turn around and your stock portfolio will gain back the lost ground and then some.
You Need a Plan
Have a clear investment plan moving forward. An asset allocation that is within your risk tolerance and a rebalancing program. Know how much income you’ll need to cover your annual expenses, the savings rate and annualized return needed to achieve FI, and an income strategy during retirement. This investment plan will keep you from hitting the panic button during bear markets. Remember that sound investing is about building a portfolio of stock and bond index funds and holding it for a long time, and that the fundamental return of initial dividend yield plus subsequent dividend growth is only achieved over the long term.
The Investment Media – Ignore It
If you can’t, view it only as a source of entertainment. Heeding the Talking Head’s advice will have you constantly buying and selling, in and out of different stock and bond sectors, gold, and commodities, usually after a big run up in price. As the economist Paul Samuelson said, “Because we can’t predict the future, we diversify.” The most practical approach is to own a little bit of everything, so part of your portfolio is there when lightning strikes, instead of constantly chasing returns in a futile effort to hit it big.
The Rest of the News Media – Ignore It, Too
Also ignore the news media when it comes to investing (this is also good for your mental health). There’s always a continuous stream of bad news emanating from your newspaper, t.v., radio, Internet, news magazines, etc. Bad news sells. But have a look at the following graph, which shows the growth of $100 invested in business since 1927, versus other investments such as bonds and bills.
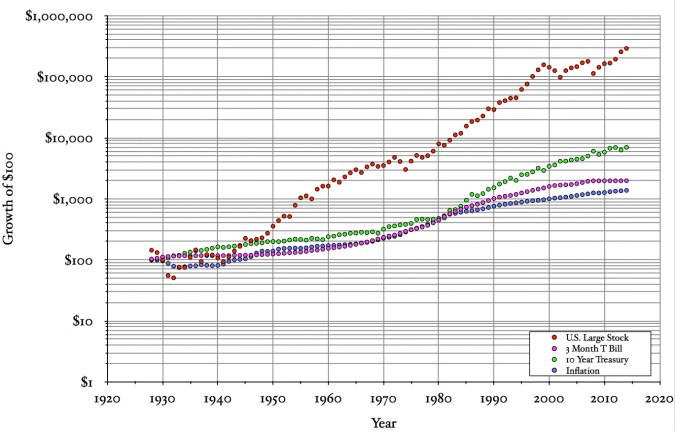
Long term growth of $100 from 1928 through 2014 for large cap stocks, bonds, bills, and inflation. This graph shows the long term advantage of investing in business, where real goods and services are created and sold to generate and grow earnings. Sources: Kenneth French; St. Louis Federal Reserve; inflationdata.com.
Relentlessly Upward, Despite It All
The U.S. large stock slope is relentlessly upwards over a long span of time. Now think about all the bad news and scary world events that have occurred during this time period: the Great Depression, Dust Bowl, the rise of Hitler, World War II, Korean War, Cuban Missile Crisis, the Cold War, Vietnam War, Gulf Wars, Three Mile Island, Chernobyl, Peak Oil, terrorism, drought, extreme weather events, rising interest rates, falling interest rates, 1987’s Black Monday (a one day market decline of 22%), the credit crunch and Great Recession of 2008, and the coming and going of 15 Presidents.
This just scratches the surface. The list goes on and on and on, but dividends and earnings growth of U.S. and international business continued more or less unabated. So keep this in mind if some news story about Greek debt or the upcoming Presidential election is causing you to think twice about investing, or keeping you up at night if you’re already invested in the market.
Market Timing – Don’t Bother
Oh, unless you can predict the future, then go ahead. For the rest of us, market timing is a fool’s errand, so don’t bother. Sure, it would be great to sidestep the down markets and get back in during the upswings. The only problem is, no one can do this consistently over the long term. If it was easy, you’d be a billionaire. Stock market gains (and declines) tend to come in quick, short bursts that are impossible to predict. No one rings a bell to signal when to sell, and no bell rings to alert you to subsequently buy (and for market timing to work, you need to be right on both the sell and buy sides, over and over and over again).
For example, during the first 14 weeks of 1997, the market fluctuated up and down with a return of zero. A sustained updraft over the next 27 weeks resulted in a 33% gain. The next 11 weeks? Nothing. Could the 33% gain be predicted? No – and if you were out of the market during those 27 weeks your annual return for 1997 was zero. This is only one example – there are many years similar to 1997.
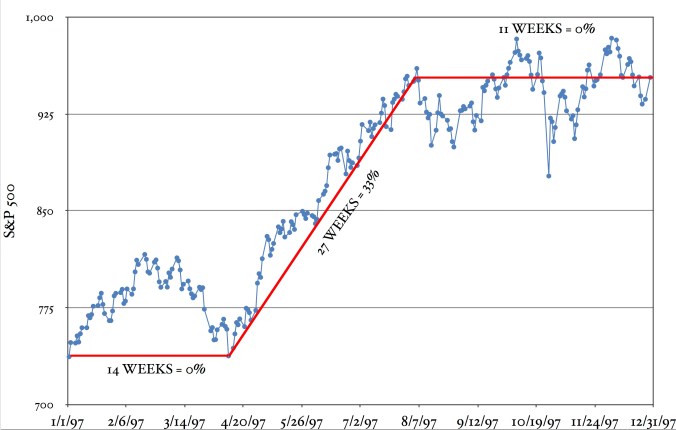
During the first 14 weeks of 1997, the market fluctuated up and down with a return of zero. The next 27 weeks was a sustained updraft with a 33% gain, then the next 11 weeks, nothing. Could the 33% gain be predicted? Nope. The only practical option is to stay in the market at all times and stay the course. Source: Standard & Poor’s.
Time in the Market
The key to investment success is not timing the market, but time in the market. The only practical option is to stay in the market at all times and stay the course. For example, if you were investing in the stock market from 1991 through 2010, your annualized return would have been about 9.1%. But if you were out of the market for only the 20 best days of the 20 year period, your return would have been just 3%. No one could tell ahead of time when these 20 days would happen, so again, it’s best to just stay in the market through good times and bad.
The Final Lesson
Set and forget your investments and ignore the market as best you can. That said, it is important to keep an eye on the P/E ratio to see how expensive the stock market is as a whole. For example, it would have been prudent to pare back your stock exposure during 1999, when the world went bonkers over the Internet and the P/E was astronomical. But times when the P/E ratio is far above or below the historical average of about 15 are uncommon. Most of the time the P/E is somewhere in the vicinity of 15, so you’re better off just buying stocks a little at a time and holding them forever.
