Want to own a business? It’ll take you two minutes. Because when you buy a stock, you’re a part-owner of the company with a small claim on all future profits. If you buy a Total U.S. Stock Index Fund, you’ll be part owner of all the publicly traded companies in the United States. Add a Total International Stock Index Fund and you’ll be part owner of all the publicly traded companies in the world.
Stock Returns = Yield + Capital Gain
As I mentioned in this post, stock market returns are driven by dividends and corporate earnings growth for U.S. and international companies. Earnings are a company’s profits. Dividends are an annual payment to shareholders, paid from those profits. Over time, a growing stream of profits will push the stock share price higher because a company becomes more valuable as it grows its profits. The total return for a stock is just the dividend plus the stock price increase (i.e., yield + growth). So, the upside of stocks is the annual dividend and the potential for a long-term increase in the stock price that results from a growing stream of corporate profits. The downside of owning individual stock is the possibility of a declining stock price, or worse, the company goes bankrupt, and their stock goes to zero. But you can diversify this single-company risk away by buying the entire stock market using a simple Total Stock Market Index Fund.
What’s a Stock Worth?
What is a stock worth? Why do stock prices fluctuate? It comes down to this: the value of any investment is based on the potential stream of income it can produce. So, the price of a stock is the current value of its future stream of income. During times of economic turmoil (think October 2008) market analysts and investors look out into the distance, see ominous storm clouds brewing, and think “Hmm, the future income stream of this company looks weak and uncertain” and the price of the stock declines to reflect this change in the current value of the future income stream. The stock price will drop to the point where investors think they will be amply rewarded for the risk and buy.
It’s counterintuitive, but the best long-term stock returns are the result of buying when things are bleak, storm clouds blot out the horizon, and the fear is palpable. Stock prices drop during periods of stormy market weather. If you can stomach it and have the cash, the best time to buy is during these periods of market turmoil, because the lower the stock price when you buy, the better the long-term return when you sell. Plus, you’re buying the dividend cheap. Likewise, when market analysts look into the future and the economy looks bright and the future stream of income for a company looks strong and reliable, the stock price goes up – again, reflecting the current value of its future income stream.
Driven By News
Fluctuations in stock prices are generally driven by (surprising) news that will affect future corporate earnings. Unless you can predict the future, the news, by definition, is unpredictable. This is why stock market trends are so hard to consistently predict, certainly in the short term. By the way, this discussion is based on business fundamentals: the ability of a company to grow profits year after year and pay a growing dividend with part of those profits year after year. Every once in a while, the market flies off the rails and becomes detached from economic reality, both on the upside (think late 1990s) and the downside (think 2008). Sometimes these moods can last a long time.
Detached From Economic Reality
How can you tell whether the market is “detached from economic reality”? The price-to-earnings (P/E) ratio is a good indicator. The P/E is a company’s stock price divided by its per-share earnings. The historical long-term average P/E is around 15, with the P/E fluctuating around this average over time. This means you’re paying $15 for every $1 of corporate earnings. Anything significantly above this (say, a P/E over 20) is flirting with overpriced territory. A P/E below 15 is starting to look cheap.
I like to use the Forward P/E Ratio, shown below for the last 20 years. The Forward P/E uses next year’s estimated earnings in the ratio. Other P/E ratios including the 12-month Trailing P/E, which uses the previous year’s earnings, or the 10-Year Trailing Average P/E (uses the average, inflation-adjusted earnings over the last 10 years). While there are some quibbles with the Forward P/E Ratio (earnings tend to be overestimated), I like it because it gives you a sense of what you’ll get in the future for every $1 you invest. And it’s the future earnings that count – past earnings are water under the bridge.
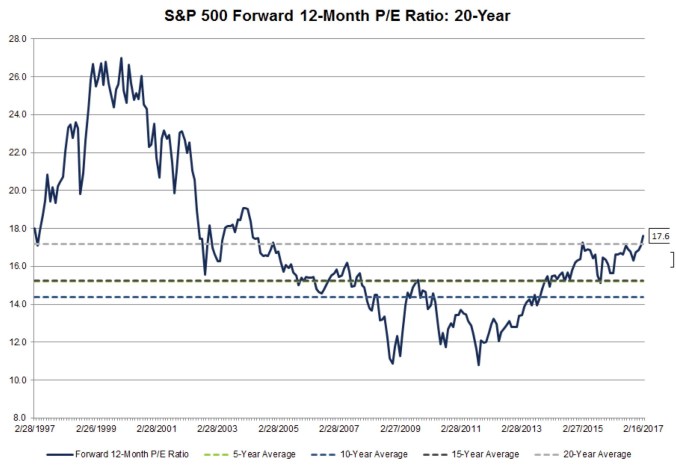
The forward price/earnings (P/E) ratio over time. The P/E ratio represents how much investors are willing to pay for $1 of corporate earnings. Notice anything unusual about the late 1990s? Investors should have been leery of stocks at this time, but instead couldn’t buy them fast enough. Source: FactSet.
What happens when you buy stocks at a P/E significantly above the average? Generally, the market realizes that a company’s earnings won’t grow nearly fast enough to support the high P/E, and the stock price drops until the P/E is back in the 15 range. This also holds for the stock market as a whole.
Earnings Yield Rule-of-Thumb
A rule-of-thumb: over the long term, the real return on stocks is roughly equal to the “earnings yield” which is just the inverse of the P/E ratio. For a Forward P/E ratio of 15, the earnings yield is 1/15 or 6.7%. The earnings ratio for a P/E of 20 is 5%. This is just another way of saying that long-term returns are better when stocks are cheap and the P/E is relatively low.
How has this rule-of-thumb held up over the years? During the last 80 years or so, the real return on stocks has been around 6.7%. The average P/E ratio was 15, for an earnings ratio of 6.7%. Not bad.
The earnings yield should be compared with the 10-year TIPs yield, which is the real, “riskless” rate of return. For example, today’s 10-year TIPs real yield is about 0.3%. The Forward P/E ratio is around 18, for an earnings yield of 1/18 = 5.5%. The bigger the spread between the 10-year TIPs yield and the earnings yield, the cheaper the stock market is relative to the bond market, and the better off you’ll be buying stocks. But again, this only holds for long-term investing – think 10, 15, 20 years here.
In a Perfect World
In a perfect world, the stock market works like this. Say a stock sells for $100 per share and pays a dividend of $3 per share. The dividend yield would be $3/$100 = 3%. During the year, the company grows its earnings by 5% and, because of this earnings growth, management decides to increase its dividend by 5% to $3.15 per share. Stock analysts, who previously valued the stock at $100 based on a $3 per-share dividend, now see the company is paying a $3.15 per-share dividend and therefore value the stock at $105 per share, a 5% increase of the initial $100 stock price. During the year the stock’s total return is the 3% dividend yield plus the 5% increase in share price, or 8% total. So stocks held for the long term should simply be viewed as a source of rising dividends. It’s the increase in per-share dividends that drive stock prices upward over the long term.
Back in the Real World
The real world doesn’t work quite like this, however, and in the short term the stock market fluctuates up and down with investor’s mood swings. But eventually, the stock market will be priced according to the business fundamentals of dividend yield plus dividend growth. Legendary investor Benjamin Graham once said “In the short run the market is a voting machine, but in the long run it’s a weighing machine.” What it weighs is corporate earnings.
Sometimes, We Can Predict the Future
Can we get a handle on the future expected long-term stock market return (think 10+ years)? Sort of, and here’s how. The expected total return = dividend yield at the time of stock purchase + subsequent per-share dividend growth rate + annualized return from the increase or decrease in the P/E ratio. The change in P/E ratio is called the speculative return, which is a reflection of how euphoric or depressed investors are as a whole and how much they are willing to pay for each $1 of corporate profits.
For example, from 1990 through 1999 the total return was 18.2% annualized. The fundamental return was only 10.8%, but a doubling of the P/E ratio during this period pumped up the stock price above and beyond the fundamental return and added an additional 7.6% to the decade’s total return. Over a period of a decade or so, the speculative return can have a significant effect on the total return, but over the very long term (on the order of decades), the speculative return balances out, and the long-term total return results from the fundamental return only. Again, the fundamental return equals the initial dividend yield plus the subsequent dividend growth rate.
At the Core of Investing
This concept is shown in the table below. It’s at the core of investing, so if you could only know one thing about successful investing, this is it. Let’s take the decade from 1980 through 1989 as an example. The initial dividend yield at the beginning of the decade was 5.2%. The subsequent annualized earnings growth rate from 1980 through 1989 was 4.4%. But note the importance of the change in P/E ratio during the decade. The P/E increased from 7.3 to 15.5 during the 1980s, resulting in an additional 7.8% of return.
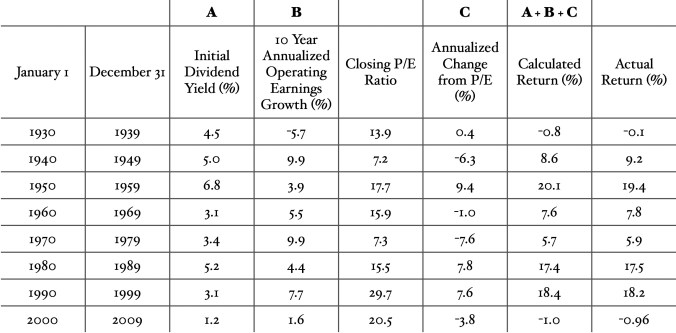
Over the long term, the expected return of stocks equals the dividend yield at the time of purchase plus the subsequent dividend growth. Changes in P/E are important over a period of a decade or so, but over the long term average out to near zero. Source: Standard & Poor’s Composite Price Index.
This means investors were only willing to pay $7.30 per $1 of profit in 1980. But as investor sentiment grew over the decade, they were willing to pay $15.50 per $1 of profit at the end of the 1980s. This pushed the market’s price upwards, above and beyond the business fundamentals. So, during this decade, the sum of the initial dividend yield, subsequent earnings growth rate, and the change in P/E equaled 17.4% – the actual return was 17.5%.
The Lesson
Pay attention to the dividend yield at the time of your stock purchase, as well as the overall P/E ratio. A relatively low P/E (between 15 and 18) will result in a tailwind to your returns during the subsequent decade, while a relatively high P/E ratio (>20) will act as a headwind. Remember the long-term average P/E is around 15, although there are good reasons why it should be closer to 20 these days, including much lower investment costs, a shrinking risk premium, and changes to accounting rules, all of which can give rise to higher valuations. There’s nothing you can do about earnings growth – it is what it is – but the historical long term average is about 5% per year.
The House Edge
Of course, no one can predict exactly what the long-term return of the stock market will be. The equation of total return = initial dividend yield + subsequent dividend growth rate + change in P/E only provides the expected return which, especially in the short term, can be very different from the actual return of the stock market, called the realized return.
This is analogous to the “house edge” for casinos. Let’s assume this house edge is 5% on average. On any given night you may do better or worse than losing 5% to the casino – thus the realized return, at least in the short term, is different from the expected return. But as most gamblers know, the longer you play the more likely the odds will catch up with you, and you’ll begin to converge on a negative 5% return. So over the long term, the realized return will likely converge with the expected return, as the influence of the speculative return wanes and the fundamental return of the stock market shines through.
Another View – Rising Dividends
Let’s look at the value of long-term investing in one other way. Remember I said stocks are just a source of rising dividends? Let’s say you bought one share of stock in Private Revolution, Inc. for $100 that paid a per-share dividend of $4. The dividend yield at the time of purchase is 4% ($4/$100). You hold on to that stock for the next 20 years.
Meanwhile, the company, which grew its earnings by about 5% per year, increased its per-share dividend by 5% per year, which drove the stock price upwards at the same rate over that 20 year period. So your share of stock is now worth $265 at the end of 20 years, and your initial per-share dividend has grown from $4 to $10.10. Because your initial purchase price was $100, your dividend yield is now 10.1% for that share you bought 20 years ago. And the total dividends you received over 20 years is $132, which is more than your original purchase price of $100. And you still have the share of stock – now worth $265 – that will continue to provide a stream of growing dividends. This is true investing.
The Predictable Demise of the Speculator
Compare this with trying to make money on short-term fluctuations in the stock price. This approach is not investing, it’s speculating. It has nothing to do with business fundamentals, which is why the long-term return of speculation is zero. Think about it: if you’re trading on short-term stock price moves, if you make money, the person on the other side of the trade will lose money. It’s a zero-sum game on average and over the long term. Speculation cannot sustain itself forever because it has no intrinsic value. Intrinsic value is the present value of a future stream of income. So a bond has intrinsic value because it will throw off a stream of interest payments during the bond’s duration. Stocks have intrinsic value because of the possibility of a growing stream of income from dividends and earnings growth. Speculation? No income stream, no intrinsic value.
The Final Lesson
Sound investing is simply buying stocks at a reasonable price relative to earnings and holding them for decades. The fundamental return of initial dividend yield plus the subsequent dividend growth rate is earned over the long term and is the reward for investing in global business. The takeaway is that the daily, weekly, monthly, even yearly, ups and downs of the stock market are just a distraction. It’s just noise, so ignore it as best you can. Focus instead on the signal – the expected long term annualized return over 10-, 20-, and 30-year periods. So, hitch your wagon to the world economy at rock-bottom expense: expose yourself to different asset classes using inexpensive index funds, reinvest your dividends, and hold for the long term.
